David Maiden Mueller
Huai-Ning Chang
Frank Sandner
Daniel Dimoski
The first objective for this experiment was to construct and characterize the performance of the iTouch motor, comparing simulated and experimental performance data. The motor was then to be used to replicate virtual devices, such as a rotational spring, damper, rotation limit, or mass-spring system. Using a combination of the Arduino and LabView, the motor was to be used as a music controller, while LabView was used to synthesize an audio signal. As seen in the following picture, the iTouch motor is a limited-rotation motor.
 A Hall-effect sensor is placed between two magnets connected to the armature for position measurment. An H-bridge was driven in sign-magnitude control mode, using a pwm i/o line and a digital i/o line from an Arduino microcontroller. For current measurment, a 1-ohm power resistor was inserted into the circuit between the H-bridge and the power-supply ground. An analog i/o line from the Arduino was used to measure the voltage across this resistor (which just so happens to be equal to the current in this case).
 Motor Characteristics:
Motor Constant: 0.0153261 N*m/A
Armature Resistance: 0.3 Ohm
Armature resistance is measured directly from multimeter.
Rotor Inertia: 3.15*10-5 N*m*s^2
From bifilar pendulum experiment, the moment of inertia J around the center of gravity can be calculated from the pendulum's period. So for R = 0.03m, m = 0.023 Kg, L = 0.3m and T = 1.24 s. J is 2.633*10-5 Nm^2.
Moreover, since the pivot is 1.5 cm away from C.G., with parallel axis theorem, Iz = ICM + Md^2. The equivalent moment of inertia Iz = 2.633*10-5 Nm^2 + 0.023* (1.5/100)^2 = 3.15*10-5 Nm^2.

 The above graph shows the free damped oscillation of the armature. We released it at Theta=90 deg and measured and amplitude of 10 deg (this was made possible by marking the 10 deg-line on the motor) after 4.1sec. as an average value of various experiments (this point is indicated by the two crossing lines. The therewith gained data gave us the envelope function pi/2*exp(-delta*t) where delta could be defined as
Damping Constant: 0.54
The periodic time showed by the oscillation was taken out of a measurement from the arduino with the hall effect sensor connected to an analog input pin. The plot can be viewed in the next figure.
 3. Include a printout of your step or impulse response.
 We can see in the step response that the armature hits the wooden stops and stays at a constant angle while the impulse response shows that once the power is cut and the armature hits the stop it bounces back.
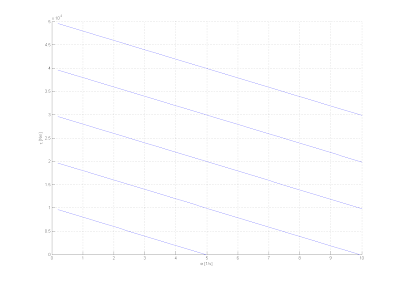
5. Draw the torque-speed curves at various voltages for your motor. You need not test at various voltages. You may draw the curves based on your motor characterization data and the motor model.We determined our motor constant K_m by lifting various known weights and observing the thereby flowing current through the motor windings. The tau vs. current graph is shown below.
 We could therewith determine the motor constant as K_m=0.0153.
With this value we could draw tau - speed curves for various input voltages V_i.
 6. Estimate the mechanical time constant of your motor. It will be related to your estimates of inertia and drag/damping.
7. Briefly describe what your velocity controller feels like when you turn the motor shaft. Why does it feel this way?

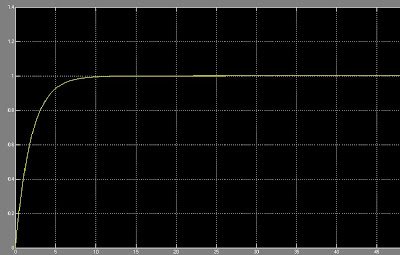
Stepresponse in Theta:
2. Certainly include the results of your experimental and theoretical frequency response experiments. Both frequency response plotted on the same graph facilitates easy visual comparison and will be duly rewarded.
 The bode diagram remains as follows. It shows a low amplification for high frequencies as we found it in our experiments in the same way.
In a next step we measured the angular displacement of the armature as a response to different input frequencies of voltage. We plotted the maximum output amplitude over the input frequencies.
 The low conformity with the theoretical data is possibly due to the fact that measuring amplitudes with the hall effect sensor resulted difficult. In each experiment it is probable to observe at least one high amplitude to other generally lower amplitudes.

No comments:
Post a Comment